COLORADO DATA SHARING NETWORK (CDSN) currently helps 62 water data organizations manage, analyze, and publicly share more than 4.8 million water quality data records at more than 12,300 Colorado monitoring locations throughout Colorado.
We are helping to enhance Colorado's watersheds and water quality by providing
CDSN's data partners and Colorado's citizens with an accessible and affordable tool kit
for data management, data analysis, and data sharing.
EXPLORE CDSN & USGS MONITORING SITES OR EXCEEDANCES IN GOOGLE MAPS & DOWNLOAD DATA FOR A SINGLE MONITORING SITE AT A TIME.
Hint: Make sure you press the "Apply Criteria To Map" button after making selections or changing map view.
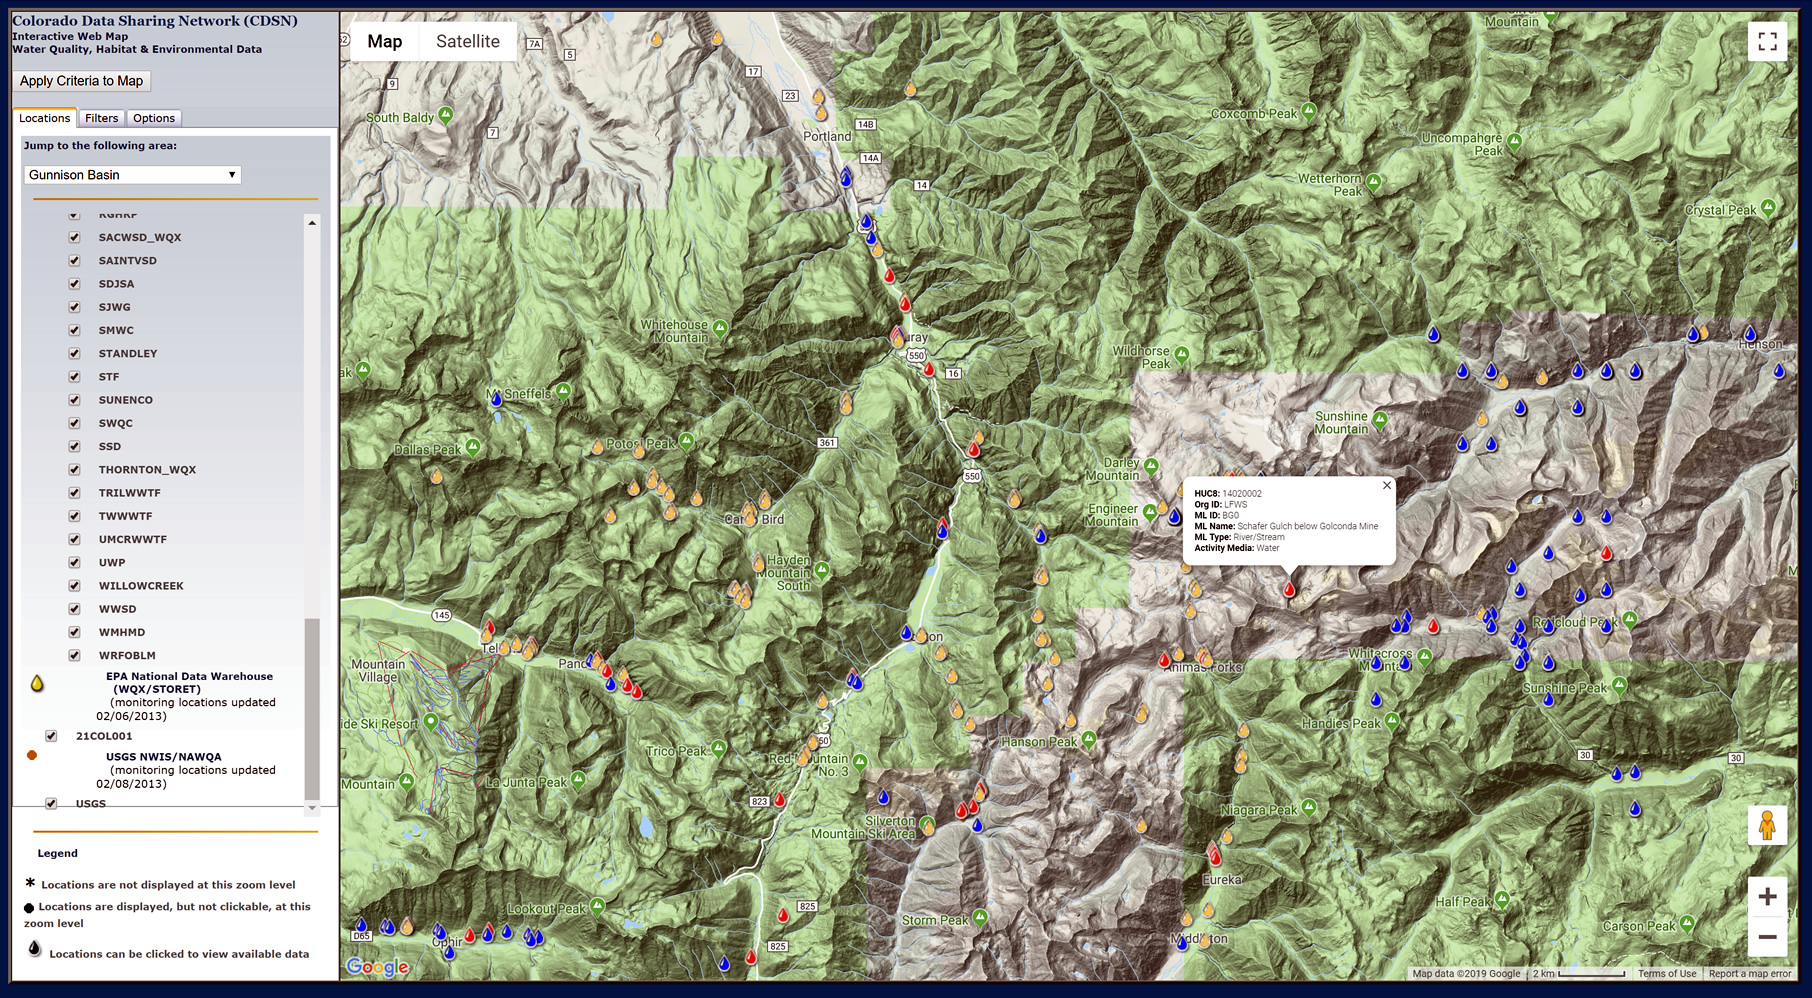
The CDSN \Monitoring Location & Exceedance Application (aka "CDSN Google-Map") was developed by CDSN in 2011, in tandem with AWQMS developers, CDPHE WQCD and EPA Region 8. In 2013, a new exceedances feature was deployed.
The application allows a user to see monitoring location metadata quickly when the mouse is rolled-over an AWQMS, USGS NWIS, or EPA National Data Warehouse monitoring location at an appropriate zoom level. A summary of water quality data results can be viewed or downloaded for AWQMS and EPA monitoring locations from the application simply by clicking on the monitoring location, again at the appropriate zoom level. Clicking on a USGS monitoring location will take you to a USGS data download page where you can download the USGS water quality results data.
The user can turn on the Exceedance filter and specify a characteristic and a threshold to the AWQMS monitoring locations (EPA & USGS monitoring locations will continue to display but do not get filtered by the exceedance function). AWQMS Monitoring locations having "hits" or exceedances will then turn red. With the Exceedance filter active, only data that exceeds the threshold specified for the characteristics specified will be provided for viewing/download upon clicking on a "red" AWQMS monitoring location. Again, the exceedance filter only works on AWQMS monitoring locations.
Application Hints:
The Map will make each user complete the free user registeration the first time it is accessed with an email address. After that the map will remember your info the next time you login with your email address. We will not share your information. You must press the "Login" Button with your mouse! Hitting the "Return" key after entering your email address will not work.
At the proper zoom-in levels, you will be able to see and interact with monitoring locations from three different databases - CDSN AWQMS, EPA National Data Warehouse, and USGS NWIS. For a CDSN AWQMS monitoring location to be visible on the CDSN Google-map, it must have activity/results data stored in AWQMS, and not just monitoring location metadata.
The Exceedance filter only works on AWQMS monitoring locations. You must zoom in enough so that the monitoring location symbol changes from a "dot" to a "waterdrop" to make the data download feature work.
Once an Exceedance filter is set, only the results data for the specified characteristic, exceeding the specified threshold will be displayed in results tables.
Roll your mouse over a monitoring location to see metadata about the monitoring location. Click on a monitoring location to view/download real-time results data into a table.
Sometimes, users will get a message box that occurs when there are no monitoring locations within your zoomed-in view that meet your search criteria. This doesn't necessarily mean that no monitoring locations matching your selected Organization or Exceedance critera parameters exist within the CDSN. You can use the Expanded Legend tab to see the full names of the data contributing organizations and the number of monitoring locations stored in AWQMS, to get an idea of where they may have monitoring locations. Zoom-out and pan around the map to see if you will find monitoring locations meeting your selected criteria from a different map view. You will need to press the "Apply Criteria to Map" button again from your new view to see if there are monitoring locations matching your critieria within your revised map view.
Legend and Statistics
This legend provides the Organization ID codes, full names of CDSN data partners (those in blue are linked to their web sites) and a summary of the amount of data by organization contained in AWQMS.
 CDSN Monitoring Location & Exceedance Application.